Map Highlights History of Expansion, ICE Contracts, Bond Statistics And More
LOS ANGELES, CA — Freedom for Immigrants is excited to launch an interactive map of U.S. immigration detention, following the reintroduction of the Detention Oversight Not Expansion (DONE) Act by Sen. Kamala Harris (D-CA) and Rep. Pramila Jayapal (D-WA).
Since its inception, our modern day immigration detention system in the United States has been expanding rapidly, ensnaring more and more people into its vast and shadowy network of prisons and jails. The DONE Act, which would stop the growth and construction of immigration detention, provides a blueprint for how we can begin to dismantle this system, while implementing true community-based alternatives to detention.
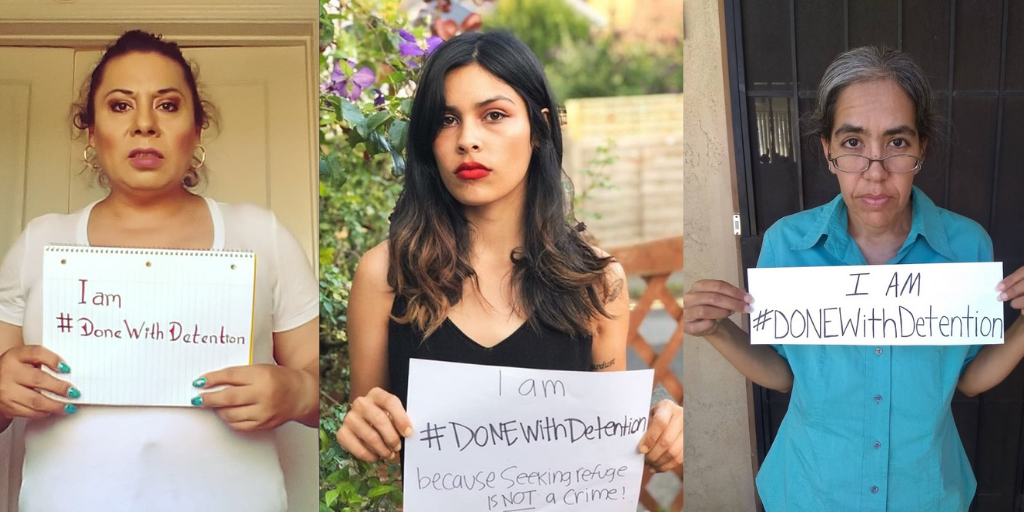
We recognize that policy is a critical tool toward ending immigration detention. We also recognize that to be #DONEwithDetention, we must all understand what detention is and how it impacts our neighborhoods, cities, states and country as a whole. Freedom for Immigrants’ interactive map sheds light on the scope immigration detention, who has the power to shape it, and what resources are available to help those directly impacted by this system.
“For far too long, millions of immigrants and their families have suffered generational trauma under the weight of our mass incarceration system. Many elected officials have turned a blind eye to the suffering of immigrants in detention while allowing private corporations to turn their plight into profit. Meanwhile, the public has been kept in the dark about the human cages that exist in their own backyards,” said Christina Mansfield, co-founder/executive director of Freedom for Immigrants. “But now that many people are waking up to this reality, we must confront it together as a country.”
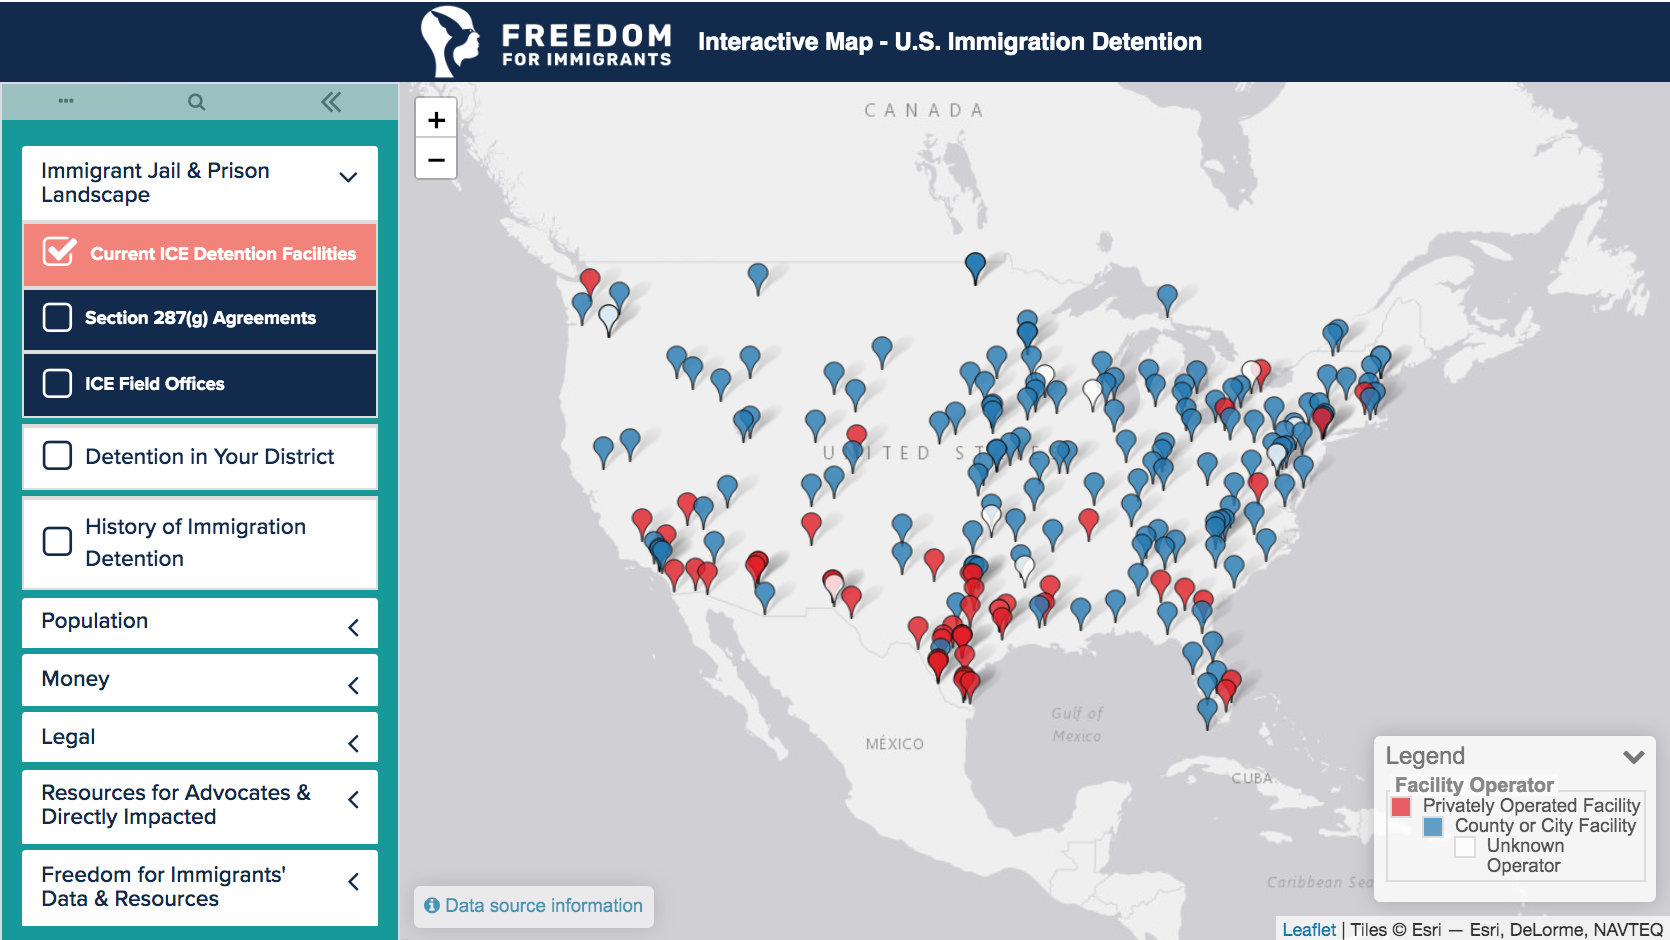
The map is organized into eight categories showing the following: the current number of long-term U.S. Immigration and Customs Enforcement (ICE) detention facilities and their growth since 1980; companies contracting with ICE; an overview of the immigration court system, including grant and denial rates for immigration bonds; available legal and advocacy resources for detained individuals and their families; and the visualization of Freedom for Immigrants’ own data and resources, including our network of visitation groups, monitoring reports and stories from inside detention that we publish on our storytelling platform IMMPRINT. The data presented is pulled from a variety of sources, including publicly available data, information obtained via FOIA requests and Freedom for Immigrants’ own documentation.
“As the Trump administration continues its war on immigrants, the need for transparency over the U.S. immigration detention system has never been greater,” said Mansfield. “We built this map not only to expose, but to inform. The map is a reflection of the country we have become — one that locks up over 50,000 immigrants on any given day. But this system does not need to define us. We have the power to change our future. We hope the map serves as both a tool and a call to action to be #DONEWithDetention.”
We invite everyone, including policymakers, scholars, advocates and concerned citizens, to learn more about the DONE Act and engage with our interactive map using this policy resource.
This work is supported by a Scholar-Activist Project Award from the Antipode Foundation.