Detention by the Numbers
Where are people detained by ICE in the United States?
Freedom for Immigrants maintains an up-to-date map of the U.S. immigration detention system. The map tracks the more than 200 immigrant prisons and jails in the U.S. as well as dozens of groups in the Freedom for Immigrants National Visitation Network.
Visit the Interactive Detention Map to learn more.
Which states detain the most immigrants?
According to ICE data from June 2023, the top five states with the largest number of people in U.S. immigration detention per day are:
Texas (9,657 individuals)
Louisiana (4,416 individuals)
California (1,793 individuals)
Georgia (1,593 individuals)
Arizona (1,592 individuals)
How many people are detained in private immigrant prisons?
According to ICE data, over 90 percent of people are held in privately-run immigrant detention centers.
Who profits from immigration detention?
Private prison corporations' perverse incentive to profit off of the prolonged imprisonment of Black, brown, and Indigenous immigrants is foundational to the immigration detention system. In fact, in the 1980's, the GEO Group and Corrections Corporation of America (now CoreCivic), successfully lobbied the government to expand detention and other forms of incarceration.
According to an OpenSecrets analysis of private prison company annual reports, the GEO Group and CoreCivic grossed $551 million and $552 million respectively from contracts with ICE alone in the fiscal year 2021. In addition to GEO Group and CoreCivic, other private prison companies with large stakes in the business of immigration detention include LaSalle Corrections and Management & Training Corporation. Local county governments also profit immensely from sheriff’s office agreements to jail immigrants on behalf of the federal government.
Where are people held in immigration detention for the longest?
According to ICE data from June 2023, the top 10 immigrant prisons and jails that hold people the longest include:
Sherburne County Jail, MN (average of 259 days)
Monroe County Detention Center, MI (84 days)
Moshannon Valley Correctional Center (78 days)
Buffalo (Batavia) Service Processing Center, NY (78 days)
Chippewa County Jail, MI (74 days)
Department of Corrections Hagatna, GU (72 days)
Geauga County Jail, OH (72 days)
Saipan Department of Corrections, CNMI (66 days)
Pike County Correctional Facility, PA (65 days)
Tacoma ICE Processing Center, WA (64 days)
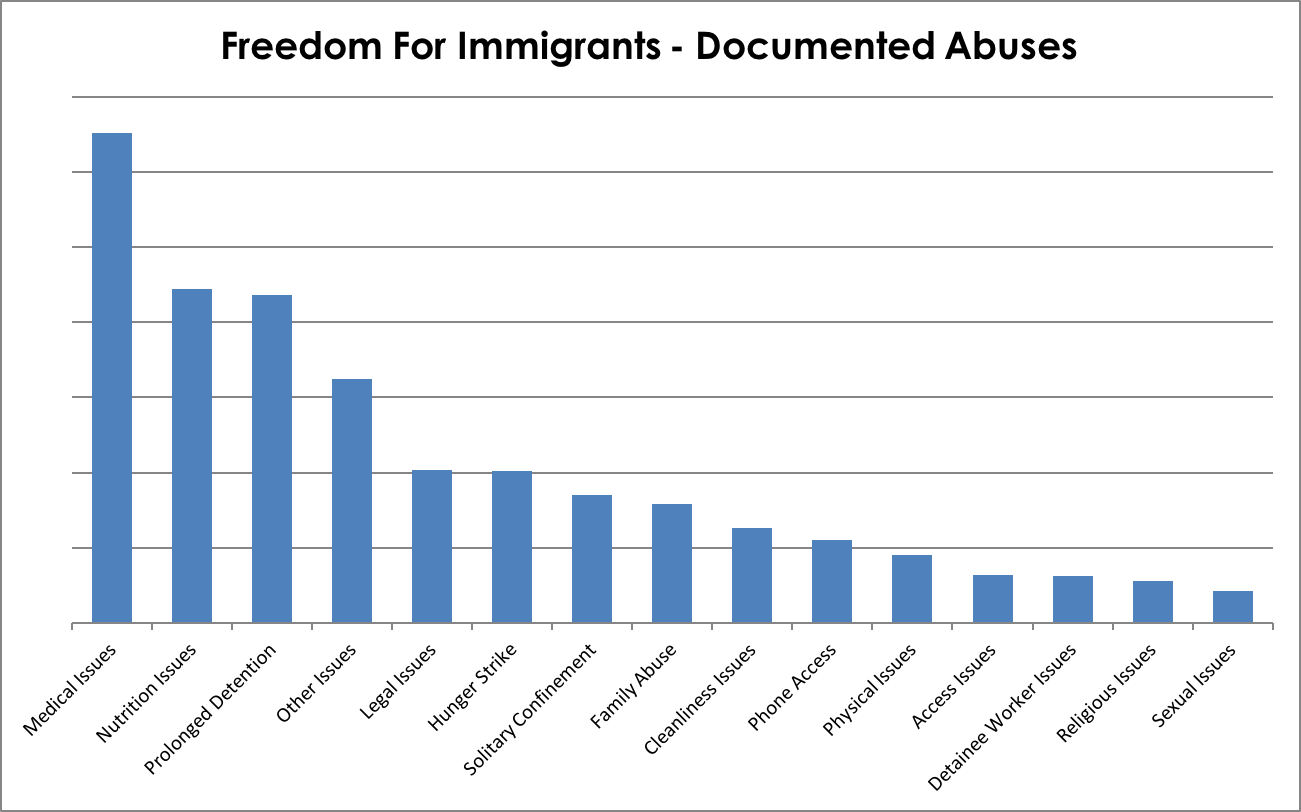
What types of abuses are reported in immigration detention?
The top complaint we receive from people in immigration detention is medical neglect/abuse.
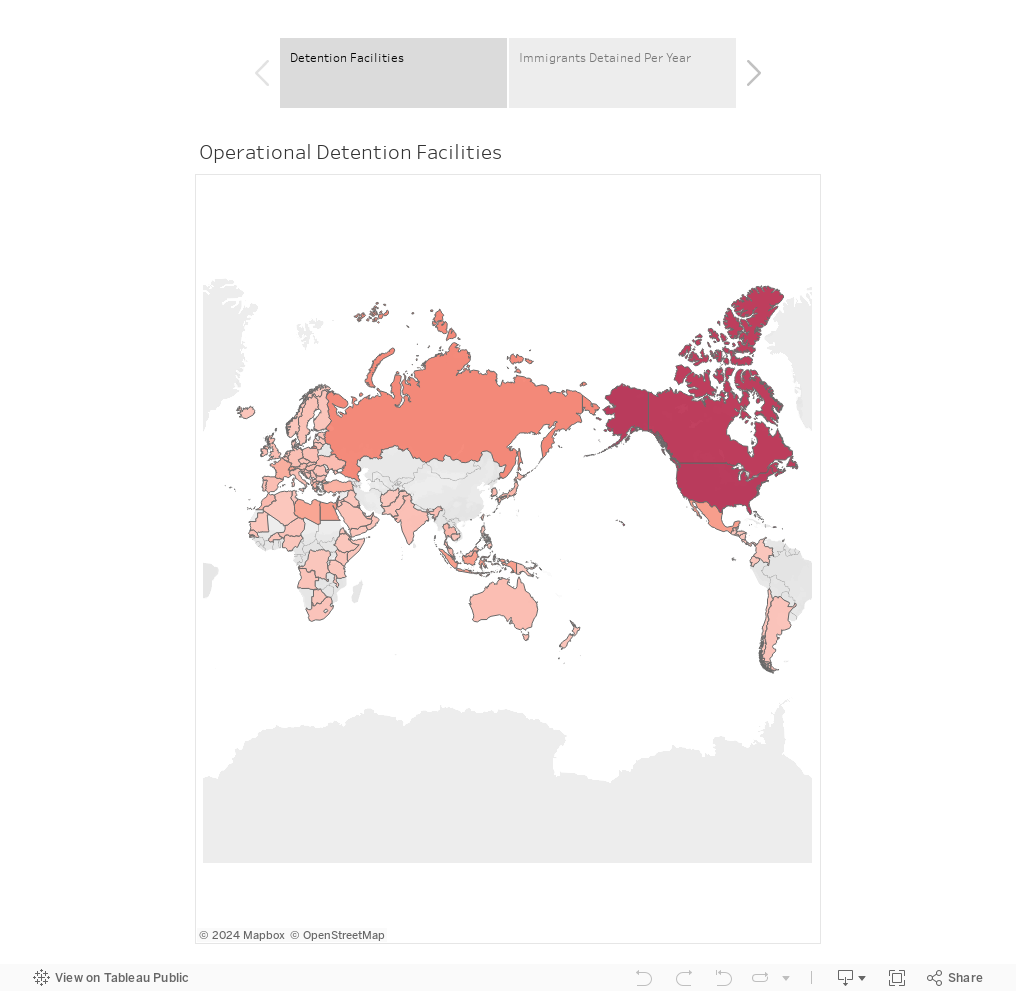
Immigration detention worldwide
There are no known statistics for the total number of immigration detention facilities and the number of immigrants detained per year worldwide. The Global Detention Project (GDP) estimates that there have been at least 2,000 facilities used for immigration-related purposes in approximately 100 different countries over the last decade. You can find their most up-to-date map here.